13/12-2023
Article: Diversifying Sports Data Applications
Read more about how diversifying sports data application can lead to expanding customer engagement and overcoming the fear of changing providers in this article.
Read more about how diversifying sports data application can lead to expanding customer engagement and overcoming the fear of changing providers in this article.

In our first article about visualizing sports data, we discussed how platforms may fail to fully harness the power of data for fostering deeper customer interactions, leading to missed opportunities for audience engagement and retention. We also dived into how companies, despite dissatisfaction, hesitate to change providers due to apprehension about potential operational disruptions, integration challenges, and potential downtime.
In this article, we will go a step deeper into thesr challenges and explore some alternative strategies that can be utilized to tackle them.

Traditional platforms are no longer the sole playground. As our digital landscape evolves, so too should the ways we engage our users. For too long, we’ve let raw numbers and statistics hide behind scoreboards and match summaries. But there’s so much more we can do, so many more ways to engage, inform, and connect with our audience. It’s time we started thinking beyond the conventional and thoroughly explore the multi-faceted world of sports data applications.
The allure of sporting insights can energize your social media updates, inspire infographics, enrich newsletters, enhance podcasts, and boost interactive widgets. This is all about using data in places where your users are actively involved. A catchy stat on Twitter or an engaging infographic on Instagram can increase visibility, start conversations, and strengthen the connection with your audience. And this is just the beginning. In no time, we’ll see this expand into digital realities like the Metaverse, where the intersection of data and engagement takes on a whole new dimension. With the sphere of sports data being so dynamic, so too should your approach to its application. The key to successfully navigating such a landscape is to choose a data provider that embodies agility and responsiveness. Reflecting on their experiences, industry insiders like Luigi Ceccon, Content Manager of Sport Network (Advertising Agency of Tuttosport), have highlighted the value of having a data partner who is skillful, flexible, and attentive – one who can swiftly address requests and resolve any product-related issues.

Infographics have swiftly risen as a powerful method for presenting sports data, substantially increasing user interaction and engagement in recent months. The secret to their success lies in their ability to simplify the story, helping fans get the key points of the data without being lost in the tiny details.
Identifying the potential of this medium, we rolled out EnetGraphics – an innovative tool fusing our comprehensive sports data with striking visual templates. Clients now gain access to an array of adaptable designs that embed our data, empowering them to create aesthetically pleasing and informative banners with just a few clicks. The best part? You maintain complete control over style and branding to maintain your brand’s identity.

The countdown is over. The Championships 2026 begin on Monday, June 29, bringing two weeks of world-class tennis, unforgettable moments, and global attention to the iconic grass courts of the All England Club.
Wimbledon has always been about more than trophies. As the third Grand Slam of the tennis calendar, Wimbledon combines rich tradition with elite competition. From thrilling five-set battles to breakout performances from rising stars, it’s a tournament that consistently delivers stories that capture audiences worldwide. For sportsbooks, media companies, and sports apps, Wimbledon is one of the busiest events on the tennis calendar.

The 2026 Tour de France starts outside of France. On 4 July, the Grand Départ takes place in Barcelona, making it the most southerly start in the race’s history. From there, the 113th edition runs for 23 days and 21 stages, covering 3,333 km before finishing on the iconic Champs-Élysées in Paris on 26 July. Stage 1 is also a departure from recent editions: a 19.7 km team time trial, the first at the Tour since the 2019 Brussels Prologue, and the first run under classic team time trial rules since 1971.
From Barcelona, the race heads into the Pyrenees as early as stage 3, before working through the Massif Central, the Vosges, and an Alpine finale that sends the peloton up Alpe d’Huez on back-to-back days, a first in Grand Tour history.
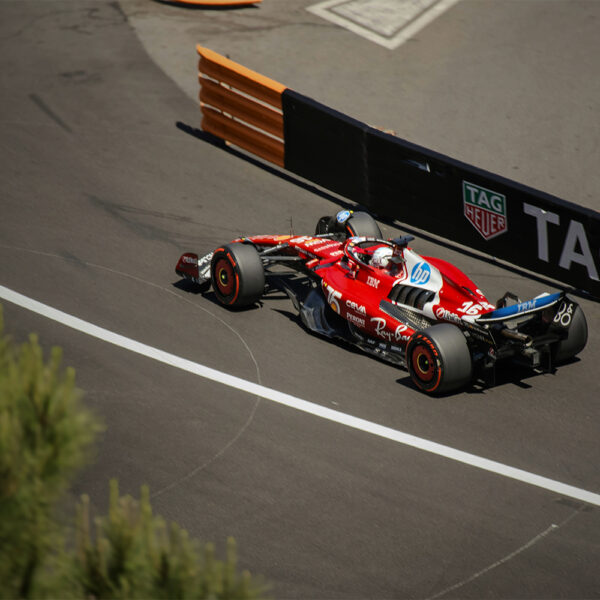
What makes the Monaco race so interesting?
Monaco is the race that makes Formula 1 feel like a different sport. The streets are narrow, the margins are tiny, and the weekend builds like a thriller: practice hints, qualifying pressure, then a race where positioning and timing can matter as much as outright speed.
That’s why Monaco doesn’t just create highlight moments. It creates attention. Fans don’t drop in only for the finish line flag. They follow the weekend session by session, checking what’s coming up, what just happened, and how it changes the bigger picture.
A random fact: At around 3.337 km, Monaco is the shortest circuit on the F1 calendar. Maybe that’s what makes it so interesting?