
Bringing
sports data
to life
Learn how EnetGraphics helps Livesport provide easy and accessible sports data content worldwide, through brands like Flashscore and Livesport.cz.
Why Livesport chose EnetGraphics
Product Manager at Livesport, Vojtěch Bruk, explains why EnetGraphics was their top choice:
“EnetGraphics stood out because it offered a dynamic and highly customizable way to present live match data and stats. It aligned perfectly with our goal to deliver real-time, engaging content to our users, especially across mobile and social platforms.”
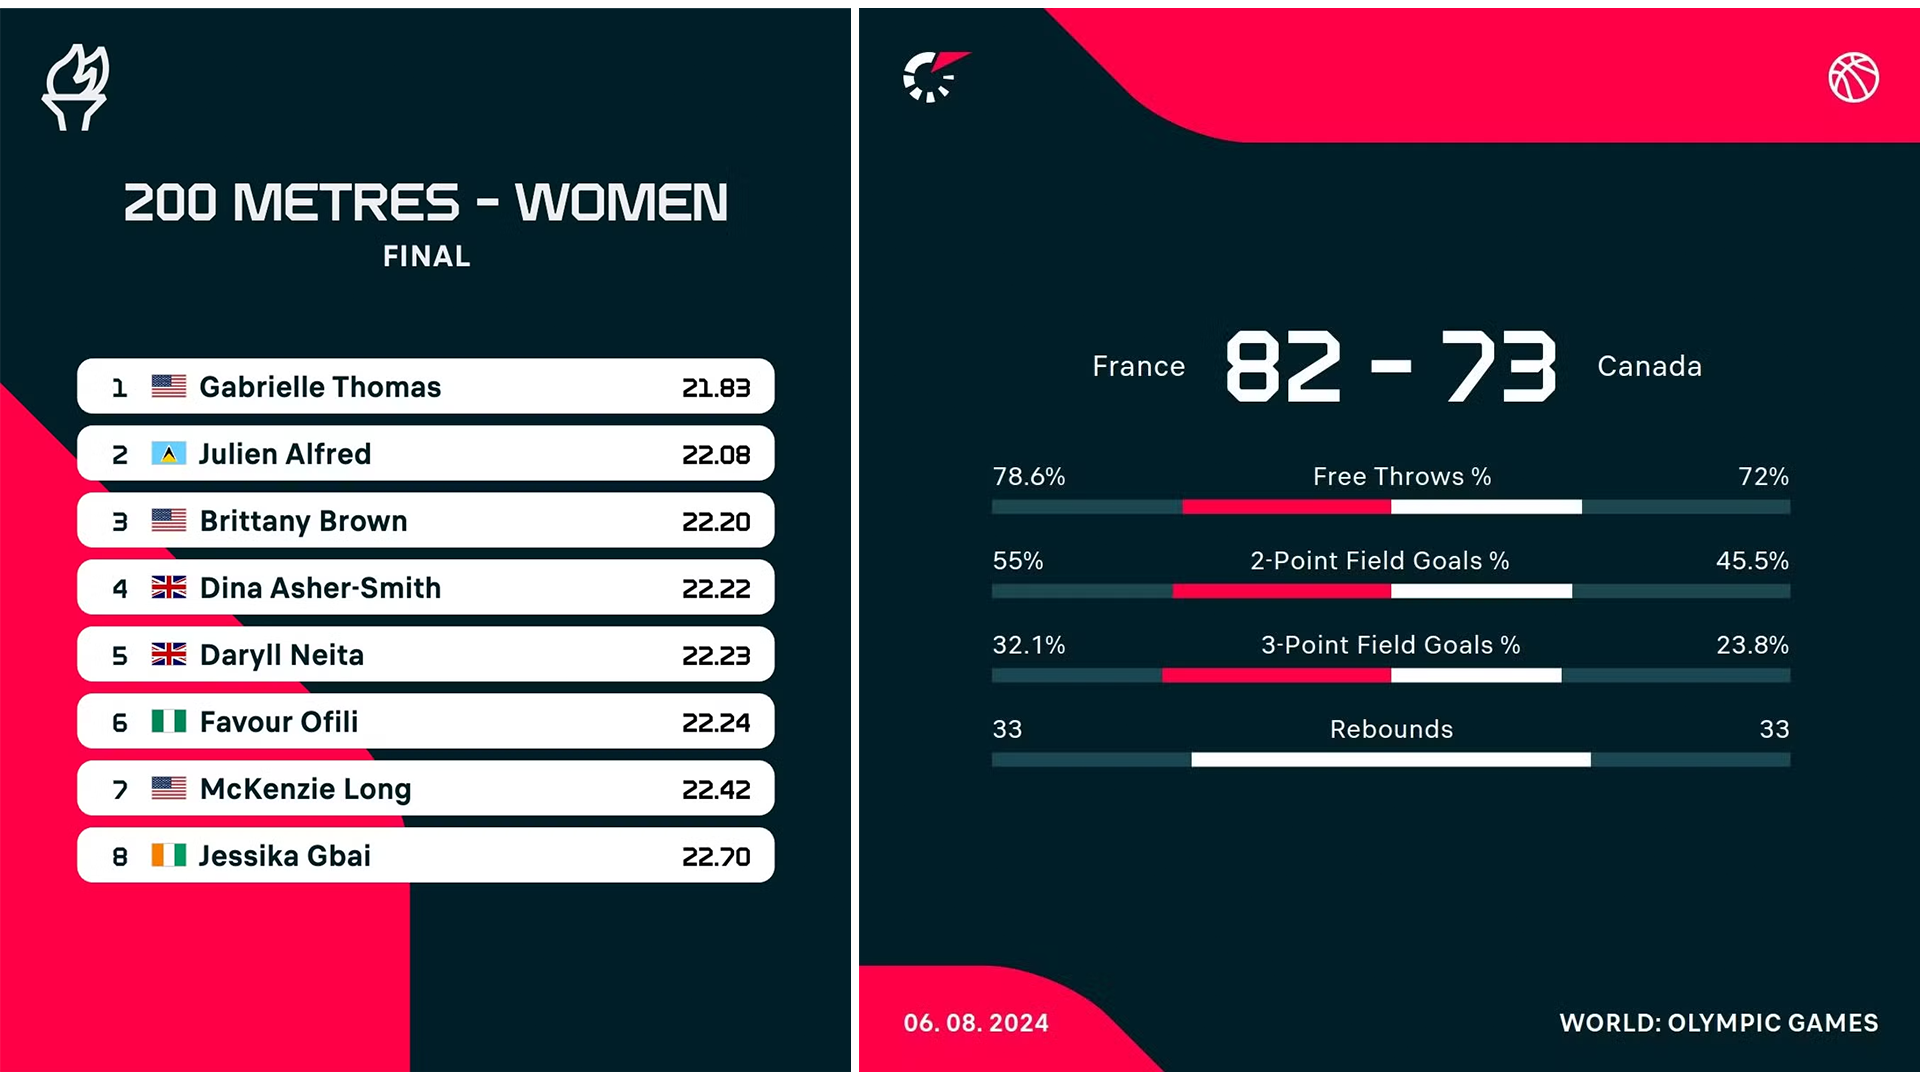
One of the reasons Livesport chose us, was because our sports infographics could be tailored in real-time to match the flow of the game and expectations of modern fans.
Turning data into engaging visuals
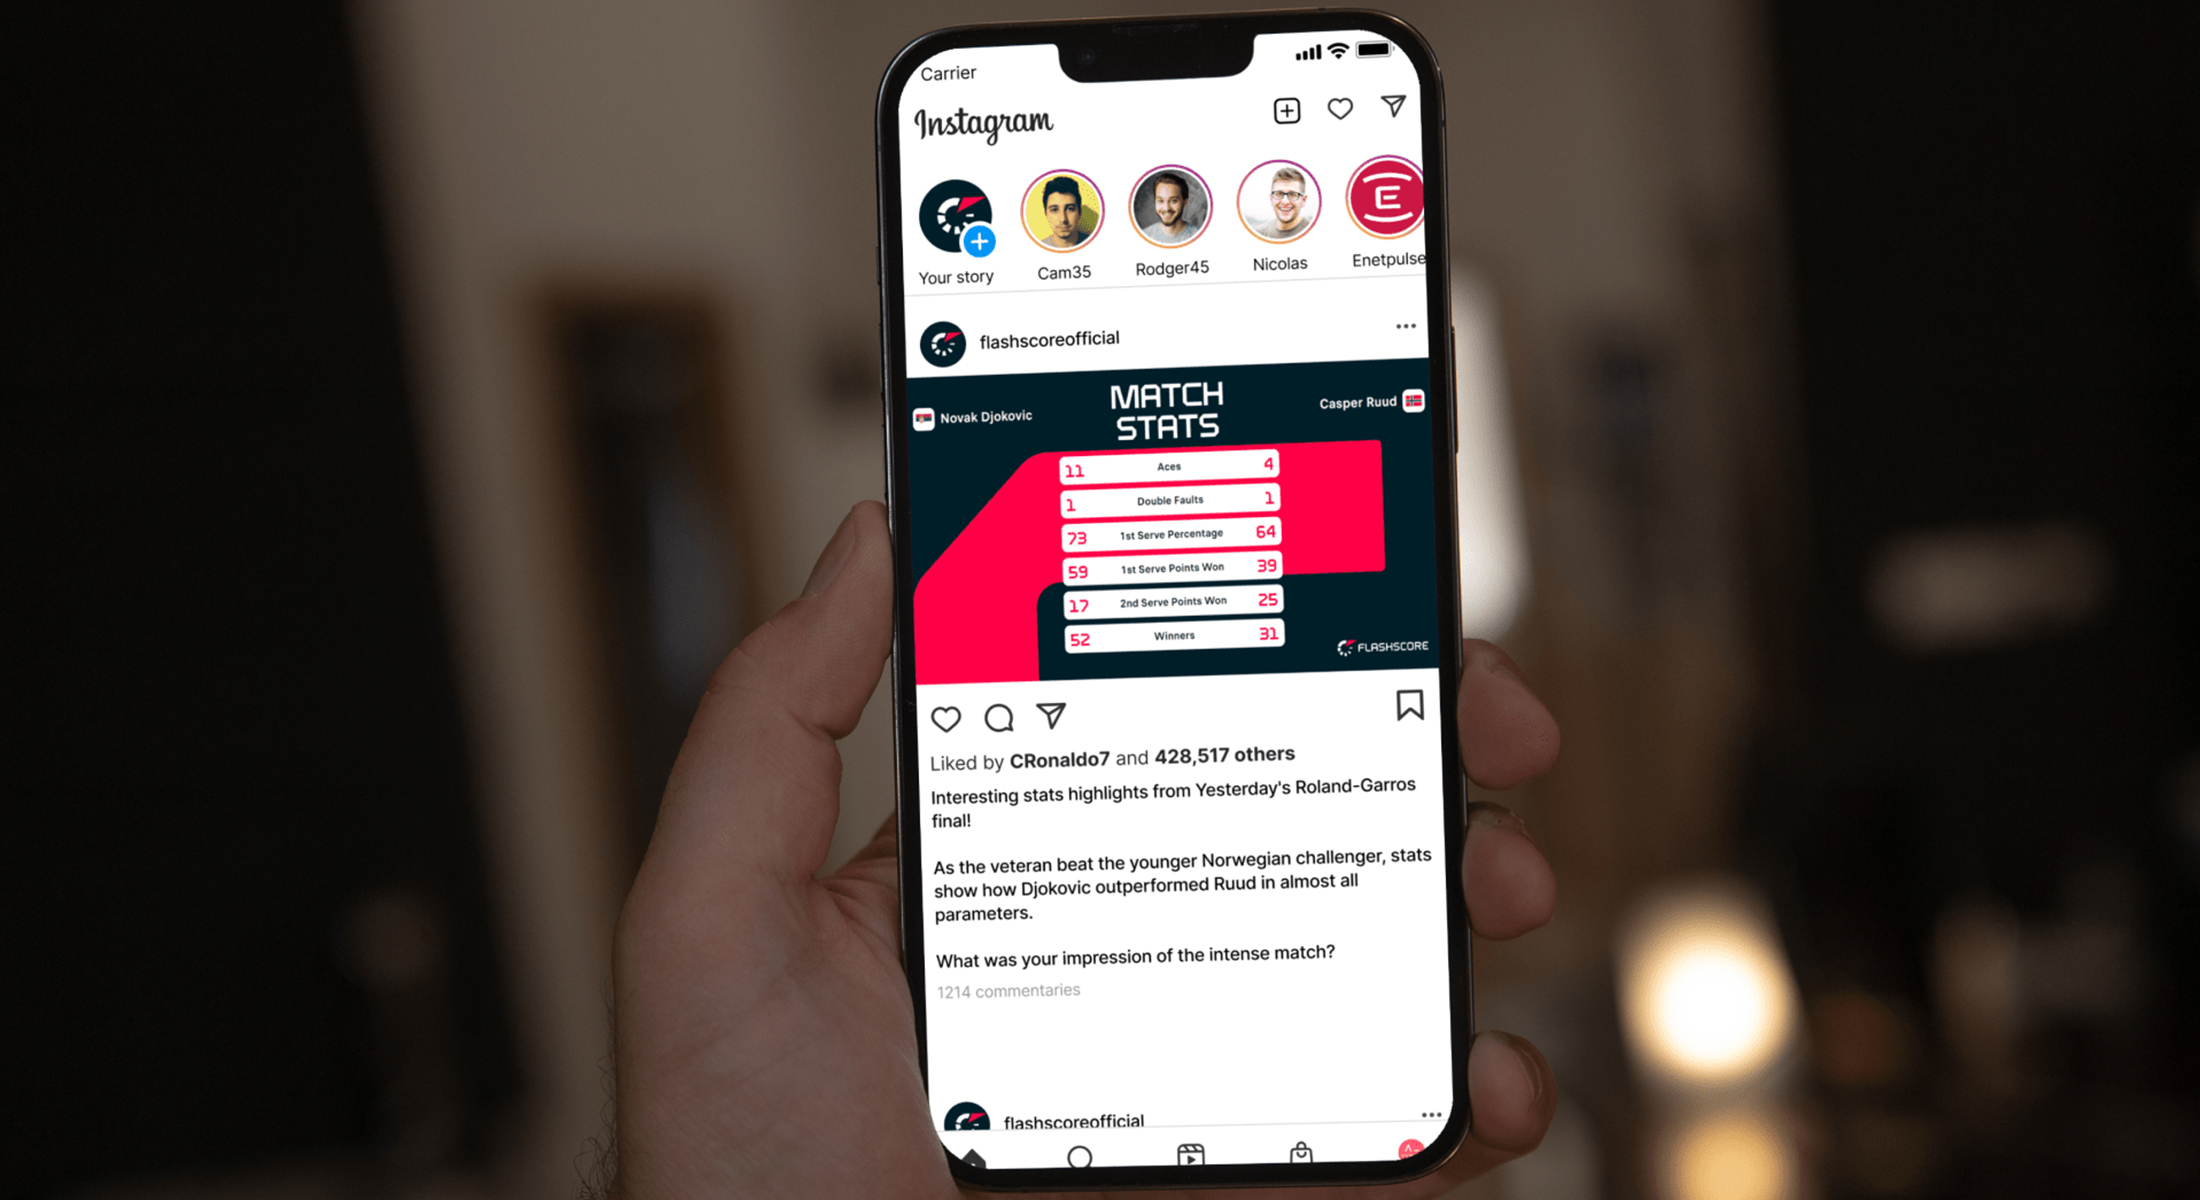
Timing is critical. Whether content captures attention or loses relevance can depend on just a few seconds. EnetGraphics was built to meet that demand, enabling Livesport to transform sports data into visuals almost instantly.
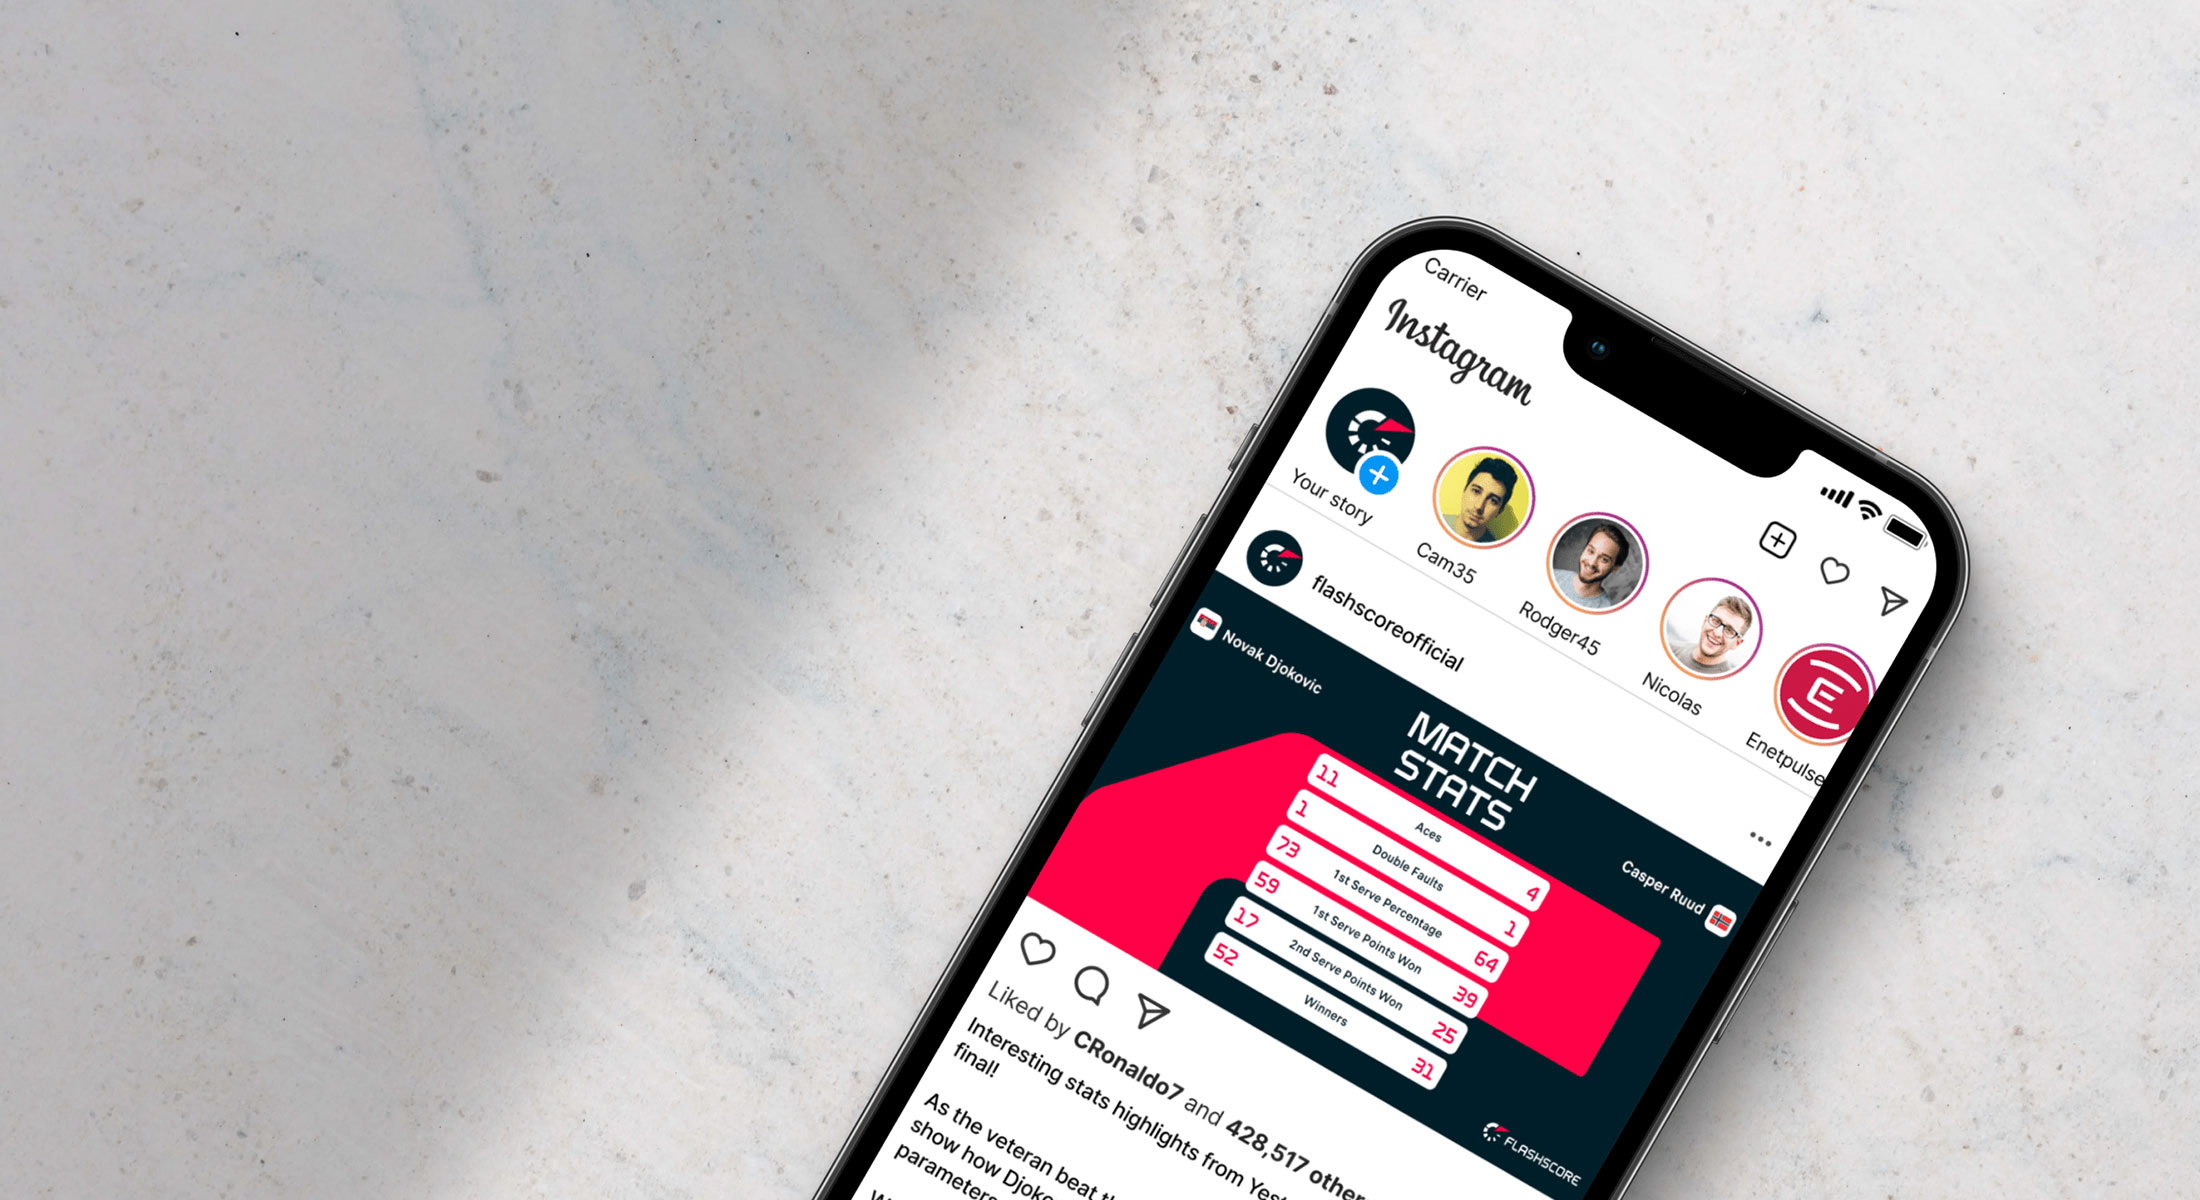
“EnetGraphics allows us to turn sports data into compelling visuals almost instantly… The visuals are clean, informative, and enhance the storytelling around the match.”
Livesport can even connect their own data stream with a visual flexibility, which is just one of the perks of using EnetGraphics. It’s designed to minimize the need for manual editing, making it possible to publish in seconds.
Since integrating EnetGraphics into their workflow, Livesport has seen measurable improvements in content quality and operational efficiency. They now deliver more visual content in less time, with a consistency that builds trust and recognition among their audience.
“It’s helped us connect better with users who prefer quick, visual consumption over text-heavy updates” Says Vojtěch.
EnetGraphics takes care of the complex data visualization, giving the Livesport team more freedom to focus on creative direction and strategic content planning.
Creative freedom
Livesport has highlighted several EnetGraphics features that helped them present sports data in an easier way:
● Customizable templates
With the ability to adjust colors, logos, fonts, and layout, Livesport ensures every infographic aligns with their visual identity.
● Background uploads
Incorporating their own branded backgrounds added a layer of personality to each visual.
● Multi language and sports coverage
EnetGraphics covers multiple sports as well as languages.
These features combine to create a solution that doesn’t just meet editorial needs – it also improves them.
Whether you’re working on a tight schedule or managing coverage across multiple competitions, EnetGraphics provides a smart, scalable solution that boosts both content quality and workflow efficiency.
“Yes, EnetGraphics is a great tool for anyone looking to elevate how they present sports data. It’s fast, reliable, and makes your content stand out visually. Every time we need a visual for our content, we just send our assets in Figma from our design system to the devs, simple and effective.” Says Vojtěch from Livesport.
Livesport’s succes story is just one example of how the right data visualization tool can improve a digital sports data strategy. By turning sports data into clear, branded and shareable infographics, EnetGraphics, helps leading sports platforms like Livesport stay ahead of the game.
EnetGraphics walkthrough
Listen to our sales team member, Marc Lyster, explain our sports infographics feature, EnetGraphics, and how the all-in-one solution improves the efficiency of your content team, by combining sports data with your own visuals.